Power outages, more than just a disruption, significantly impact daily life and business operations. A study by GeneratorDecision has ranked the 15 states with the worst power grids in the U.S. Here is a look at why these states struggle with power reliability, considering metrics like average outage duration (SAIDI), frequency of outages (SAIFI) and average outage length (CAIDI).
Louisiana

Louisiana, topping the list, experiences an average outage duration of 4811 minutes per year per user, a clear reflection of the state’s frequent and prolonged power outages. Each user faces about 3.28 outages annually, each lasting around 1467 minutes. The primary culprit is the state’s vulnerability to severe weather events, particularly hurricanes like Katrina and Ida. These powerful storms cause extensive grid damage, leading to long recovery times. Louisiana’s coastal geography also makes it prone to flooding, further complicating maintenance and repairs.
Oregon

Oregon’s power grid struggles with an average outage duration of 1489 minutes per year and 1.55 outages per user annually. The average duration of each outage is 958 minutes. The state’s diverse geography, featuring mountainous terrain and dense forests, contributes to frequent power interruptions. During storms and wildfires, falling trees and debris often damage power lines. Wildfire prevention measures, including intentional shutoffs, contribute to high outage times. Oregon’s focus on renewable energy can also lead to grid instability during bad weather.
Texas

Texas, with an average outage duration of 1175 minutes per year per user, faces about 2.64 outages annually, each lasting around 445 minutes. The state’s independent power grid, operated by ERCOT, faced a severe test during the 2021 winter storm. The grid’s isolation from neighboring states meant it could not import power during the crisis. Texas’s energy market, which favors low-cost power and minimal regulatory oversight, has led to underinvestment in weatherization and infrastructure upgrades, making the grid vulnerable to extreme weather.
Mississippi

Mississippi has an average outage duration of 1134 minutes per user per user and 1.97 outages annually, lasting about 576 minutes. The state’s power grid frequently suffers from the impacts of severe weather, including hurricanes and thunderstorms. Mississippi’s aging infrastructure exacerbates these problems, as older power lines and equipment are more susceptible to damage and failures. The state’s economic challenges also mean less funding is available for significant infrastructure improvements.
West Virginia

West Virginia has an average outage duration of 1117 minutes per year per user, with 2.38 outages annually, each lasting around 469 minutes. The state’s rugged terrain poses significant challenges for maintaining and repairing power lines. Additionally, West Virginia’s economy, heavily reliant on coal, has led to an underinvestment in modernizing the electrical grid. The state frequently experiences severe weather, including heavy snow and ice storms, which can cause widespread and prolonged outages.
Michigan

Michigan’s power grid faces an average outage duration of 873 minutes per year per user. Users experience about 1.66 outages annually, each lasting around 527 minutes. The state’s harsh winter weather, including heavy snow and ice, often leads to downed power lines and prolonged outages. Michigan’s aging infrastructure lacks investment in modernization. A slow transition to renewable energy leaves the state reliant on older, less reliable power generation methods.
Kentucky

In Kentucky, the average outage duration is 693 minutes per year per user, with 1.5 outages lasting approximately 463 minutes annually. The state’s exposure to severe weather events, such as ice storms, significantly impacts grid reliability. Kentucky’s hilly terrain can make maintenance and repair of power lines difficult and time-consuming. Additionally, the state’s energy infrastructure has not seen substantial upgrades in recent years, contributing to its vulnerability during extreme weather.
Washington

Washington state’s power grid has an average outage duration of 527 minutes per year per user and 1.69 outages annually, each lasting around 312 minutes. The state’s weather, including heavy rains, strong winds, and occasional snowstorms, often leads to power interruptions. Washington’s extensive forested areas mean falling trees during storms can frequently damage power lines. Efforts to balance hydroelectric power with other renewable sources have also introduced instability into the grid.
Massachusetts

Massachusetts experiences an average outage duration of 519 minutes per year per user. Users face about 1.22 outages annually, each lasting around 426 minutes. Nor’easters and other severe weather events are common causes of power outages in the state. Massachusetts’s aging infrastructure, particularly in older urban areas, contributes to frequent outages. The state’s efforts to incorporate more renewable energy sources have also faced challenges, leading to occasional instability in the grid.
Nebraska

Nebraska’s power grid shows an average outage duration of 516 minutes per year per user and 1.1 outages annually, each lasting about 467 minutes. The state frequently experiences severe thunderstorms and tornadoes, which disrupt the power supply. Nebraska’s vast rural areas can make maintaining and quickly repairing power lines challenging. Additionally, the state’s focus on agricultural and industrial activities can sometimes lead to underinvestment in the electrical infrastructure needed to support residential reliability.
Idaho

In Idaho, the average outage duration is 475 minutes per year per user, with 1.74 outages annually, each lasting approximately 273 minutes. The state’s reliance on hydroelectric power can lead to disruptions during drought or dam maintenance. Idaho’s mountainous and forested terrain makes power line maintenance difficult, and severe weather can cause significant damage. The state’s rural nature also means that outages can affect fewer people but for longer durations due to the logistical challenges of repair.
Rhode Island

Rhode Island’s power grid has an average outage duration of 449 minutes per year per user and 1.43 outages annually, each lasting around 314 minutes. Coastal storms and nor’easters are the primary factors causing these outages. Rhode Island’s small size and high population density mean that outages can have a widespread impact. The state’s older infrastructure, particularly in urban areas, often struggles to cope with severe weather events, leading to frequent and prolonged outages.
Virginia

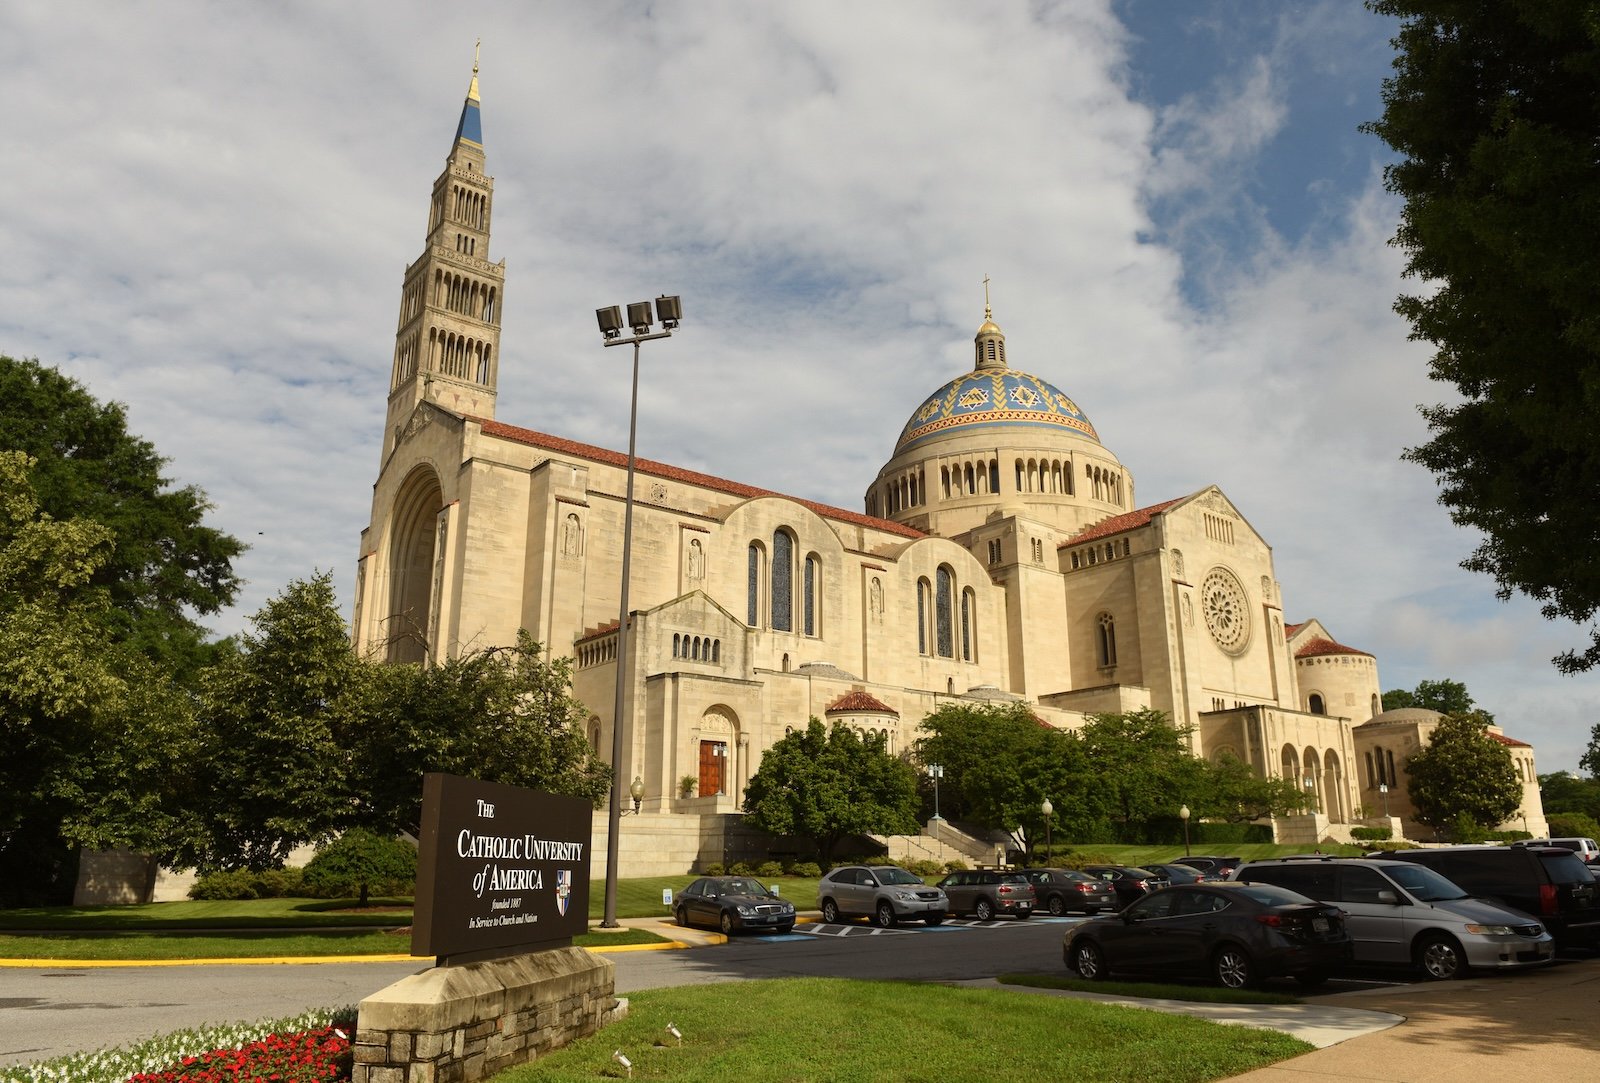
Virginia faces an average outage duration of 434 minutes per year per user, with 1.57 outages annually, each lasting around 276 minutes. The state’s grid is often affected by hurricanes and severe thunderstorms. Virginia’s mix of urban and rural areas challenges consistent power delivery and quick repairs. Efforts to transition to a more renewable energy-based grid have introduced instability as the state works to balance new technologies with existing infrastructure.
Alaska

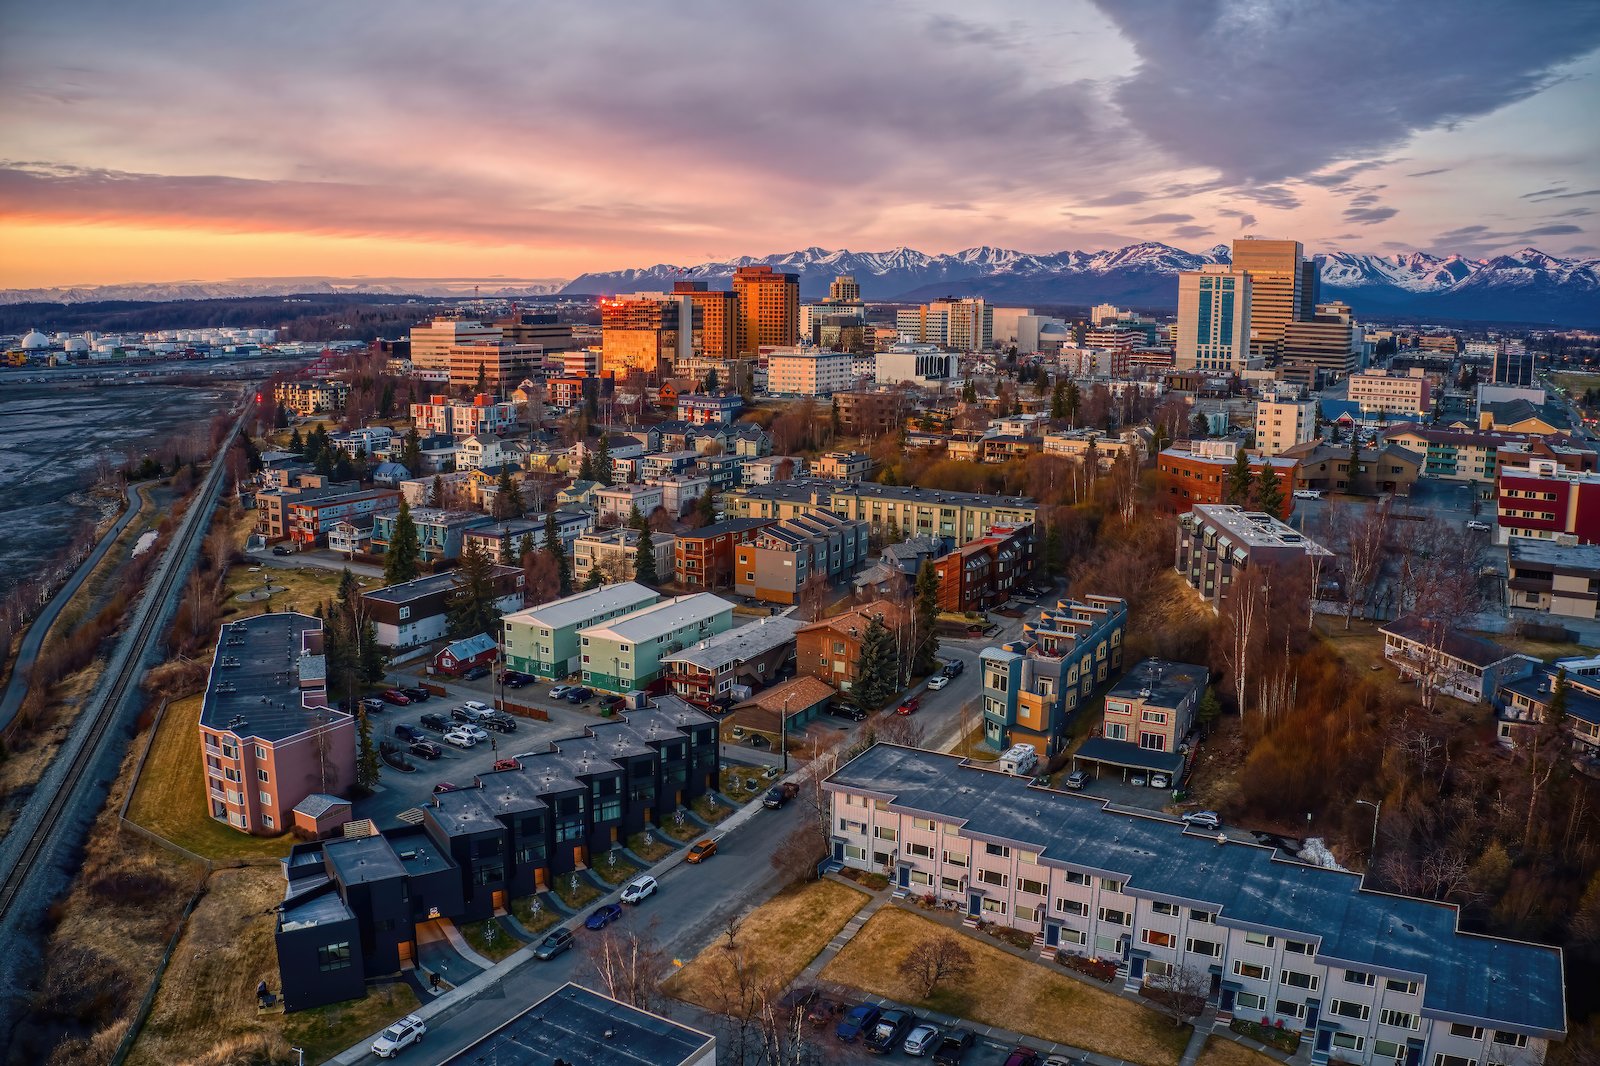
Alaska’s unique challenges result in an average outage duration of 379 minutes per year per user. Users experience about 2.13 outages annually, each lasting around 178 minutes. Harsh weather conditions, including extreme cold and heavy snowfall, complicate maintenance and repair efforts. Alaska’s vast and remote geography makes it difficult to address power outages quickly, and the state’s reliance on diesel generators in remote areas can lead to frequent interruptions.
Kansas

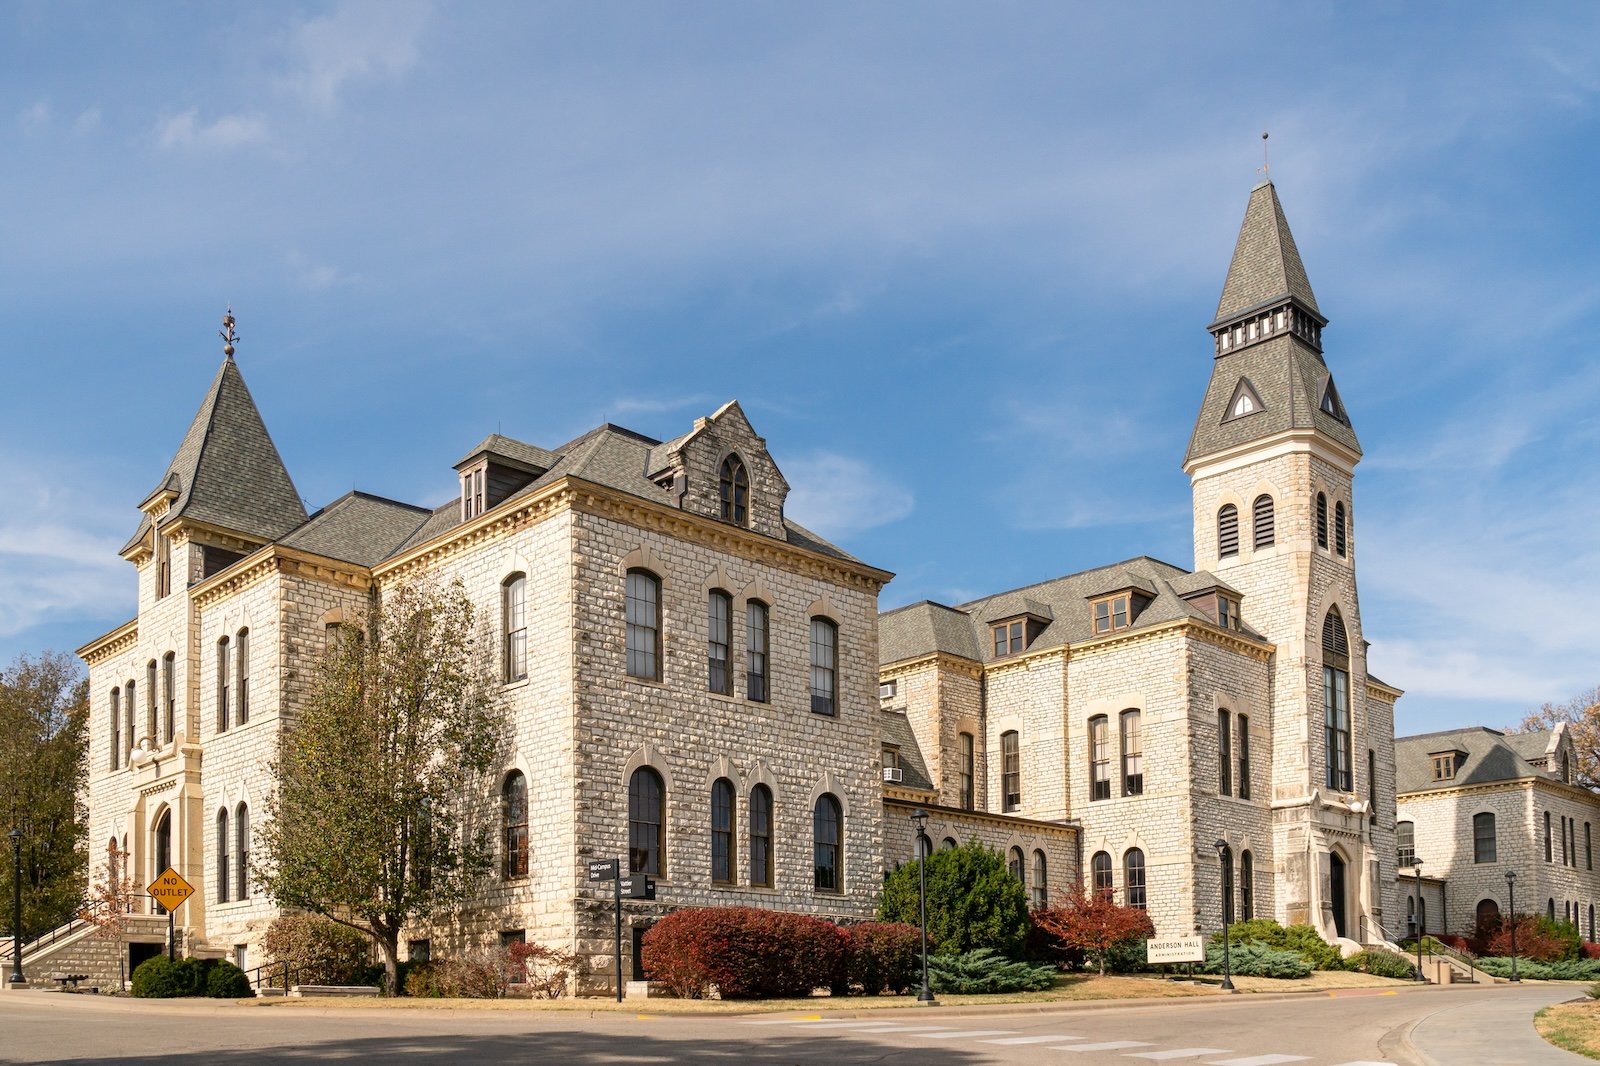
Kansas experiences an average outage duration of 341 minutes per year per user and 1.41 outages annually, with each lasting around 242 minutes. Severe thunderstorms and tornadoes frequently disrupt the state’s power grid. Kansas’s flat, open terrain makes power lines vulnerable to high winds and lightning strikes. Additionally, the state’s focus on agricultural activities sometimes leads to underinvestment in the electrical infrastructure needed for residential reliability.


