
Driving is a skill that requires attention, patience, and responsibility. However, not all drivers are equally adept at following the rules of the road and avoiding accidents. Some cities in the U.S. have a reputation for having the worst drivers. A recent study based on a comprehensive analysis of multiple metrics revealed the top 10 cities with the worst drivers in the U.S. The results may surprise you or confirm your suspicions, depending on where you live or have driven. Read on to find out which cities have the worst drivers in the U.S. and why.
Jacksonville, Florida

Jacksonville is notorious for having the worst drivers in the U.S. With 2.9 alcohol-related driving deaths per 100,000 people, Jacksonville tops the list for this grim statistic. The city also suffers from a high rate of traffic fatalities in general, with 10.9 deaths per 100,000 people. This is 65% above the average of the cities studied (6.6) and the third-worst, after Memphis and Birmingham. One factor contributing to this problem is Interstate 95, which cuts through the city and is known as one of the most dangerous highways in the nation.
Louisville, Kentucky
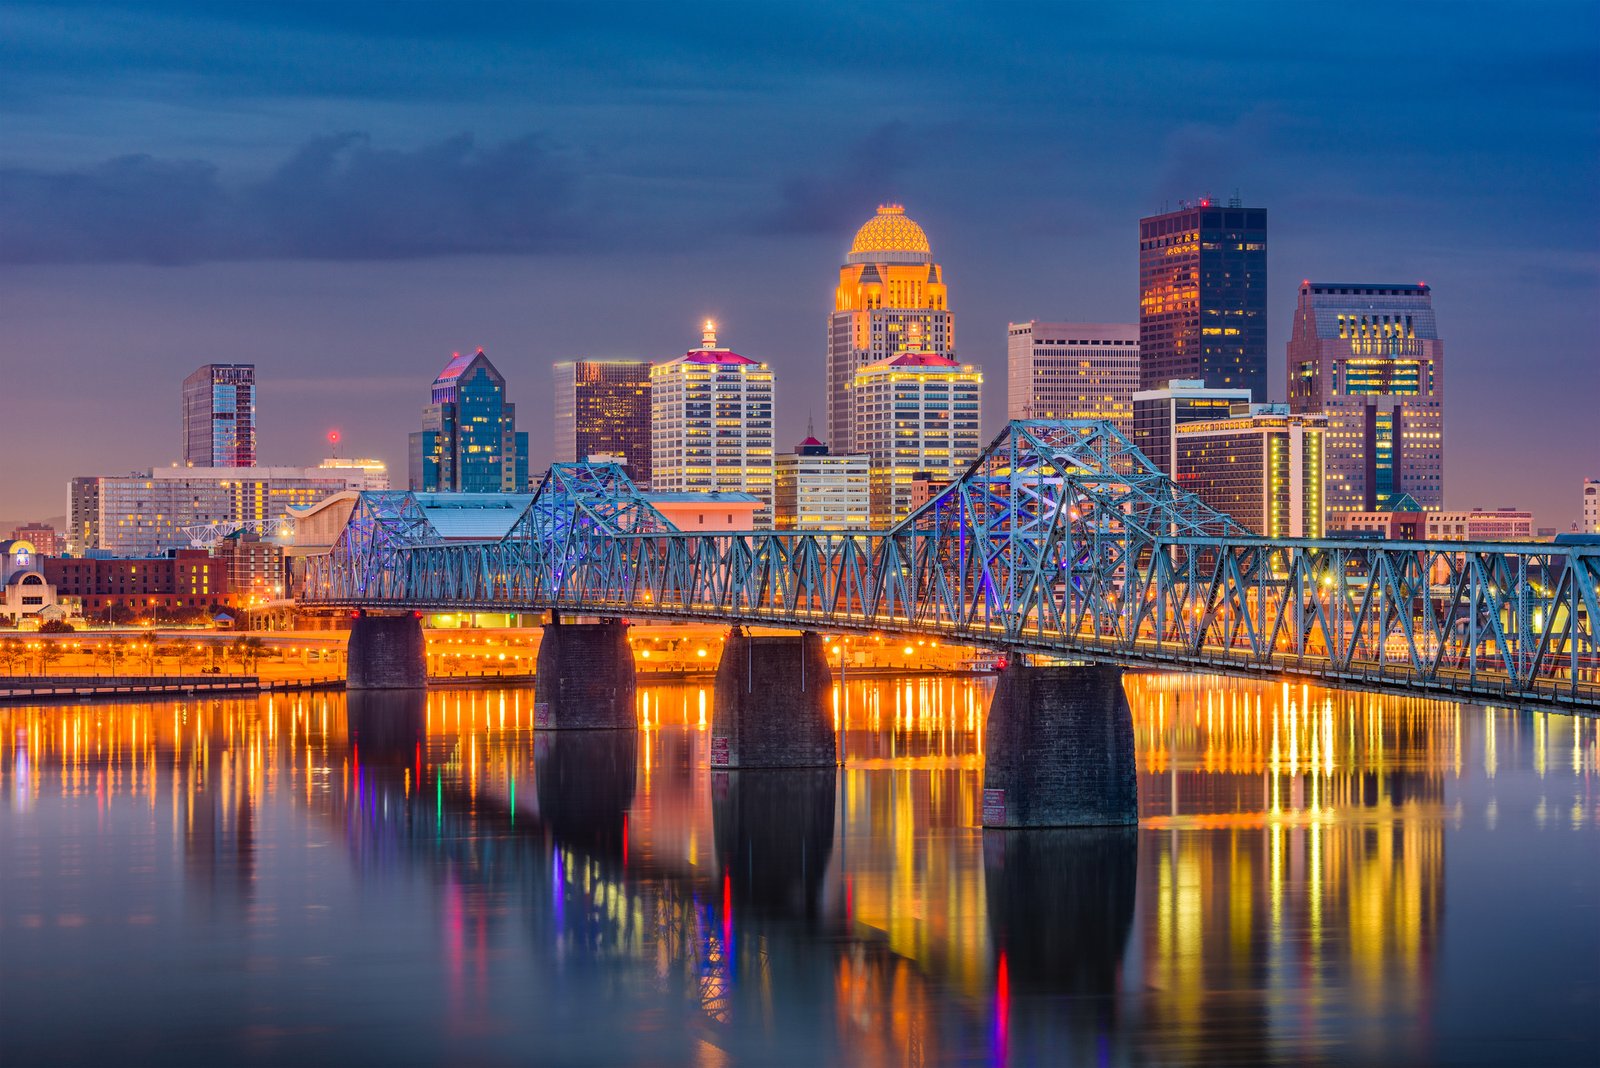
Louisville is a city with a severe driving problem. It has the third-highest rate of alcohol-related driving deaths (2.5 per 100,000 residents) and the fourth-highest rate of overall traffic fatalities in the country. The city’s annual driving death rate is 10.2 per 100,000 people, which is 53% higher than the average of the cities we studied (6.6). The city’s economy relies heavily on trucking and shipping, which means more semis on the road and more deadly crashes. Louisville drivers are also more likely to file claims than the national average and rank poorly on Allstate’s best drivers report.
Orlando, Florida

Orlando is a famous tourist destination. However, driving here can be very dangerous for locals and tourists—Orlando drivers experience 23 hard-braking events per 1,000 miles, higher than the national average (19). Hard-braking events are sudden and forceful stops that can also lead to rear-end collisions, damage to the vehicle, and increased fuel consumption. Orlando has the third-highest number of fatal car accidents involving a distracted driver, with 3.74 accidents per 100,000 licensed drivers. Orlando also has 9.1 driving fatalities per 100,000 residents each year, which is significantly higher than the average city’s rate of 6.6.
Tampa, Florida

Tampa, Florida, is a dangerous city to drive in because of its high rate of fatal car accidents, distracted driving, and uninsured drivers. The town has ten fatal car accidents per 100,000 residents, which is the second-most in Florida and the fifth-most nationally. Tampa has a high percentage of uninsured drivers, with 20% of motorists lacking insurance coverage. This can make it harder for car accident victims to receive compensation for their injuries or damages. Tampa drivers pay an average of $3,459 to insure their vehicles, the fifth-highest among 50 cities studied.
Nashville, Tennessee
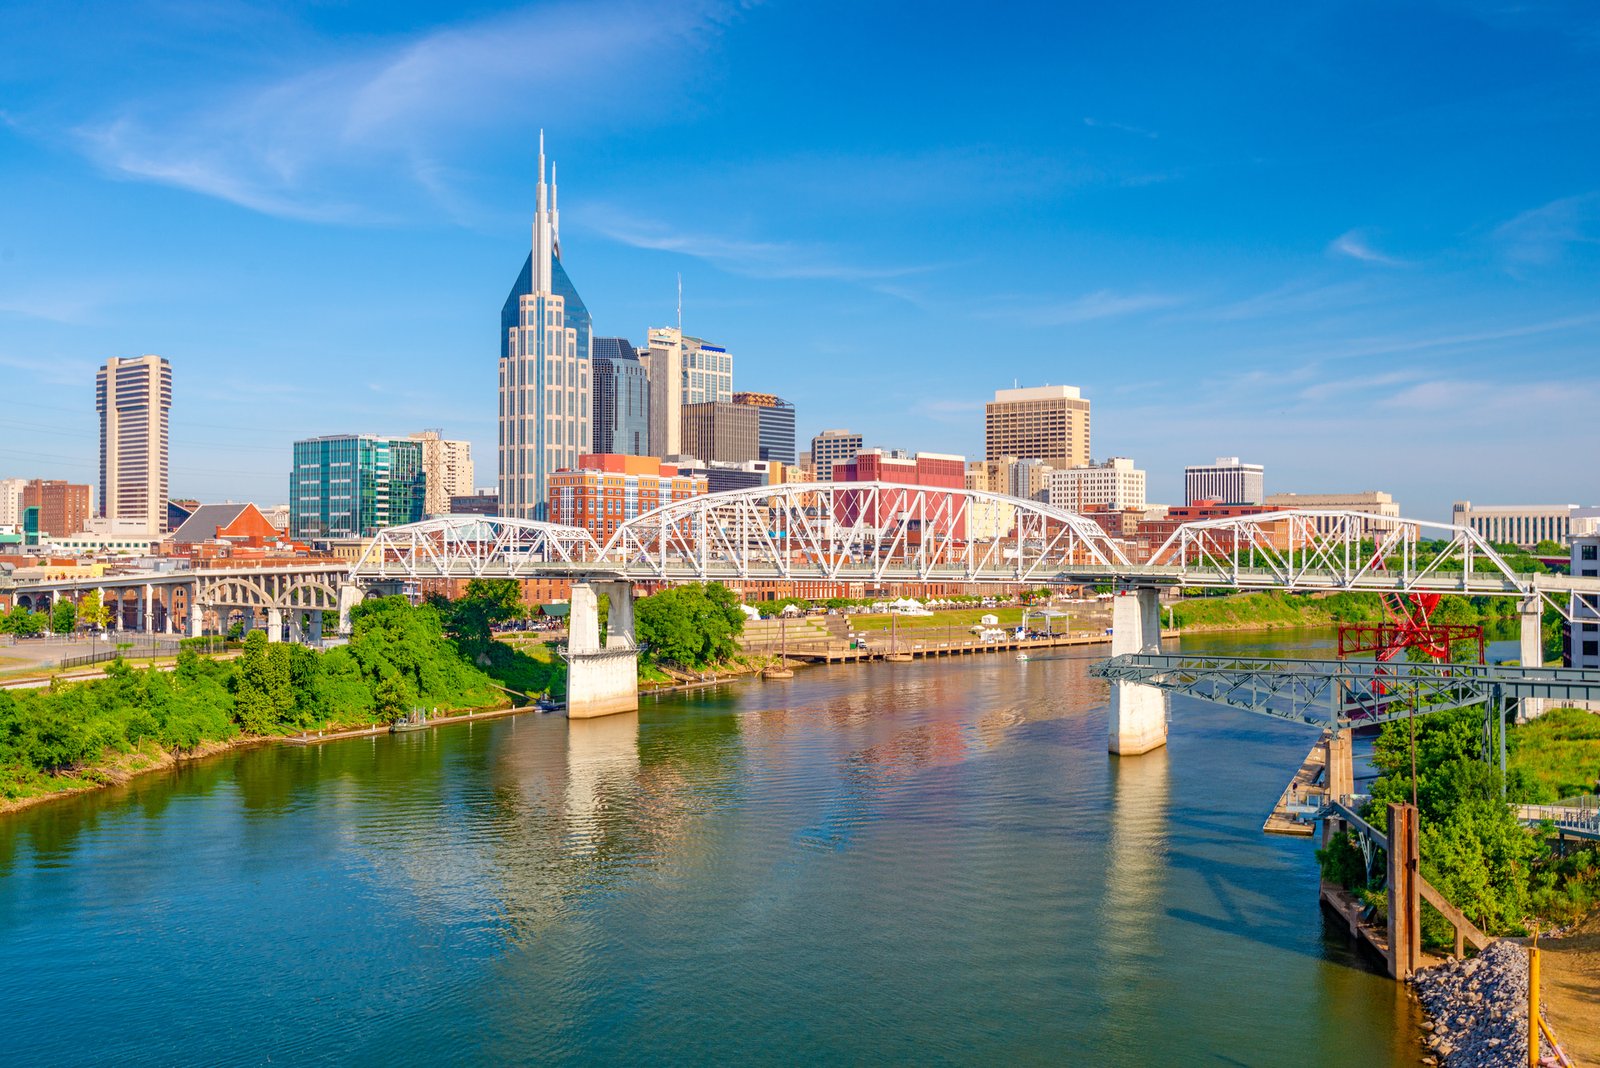
Nashville is a fast-growing city that is facing more traffic challenges as more people move there. Though the city has some of the country’s lowest car insurance premiums ($1.546), it has 24% of uninsured drivers, the second-highest in the county.
Nashville drivers are often distracted by their phones, which causes more accidents and deaths. At 9.4 per 100,000 residents, the city has the seventh-highest number of yearly driving deaths — 42% more than the studied city average (6.6). To curb the high number of deaths caused by distracted driving, the state enacted the Hands-Free Tennessee law in 2019.
Memphis, Tennessee
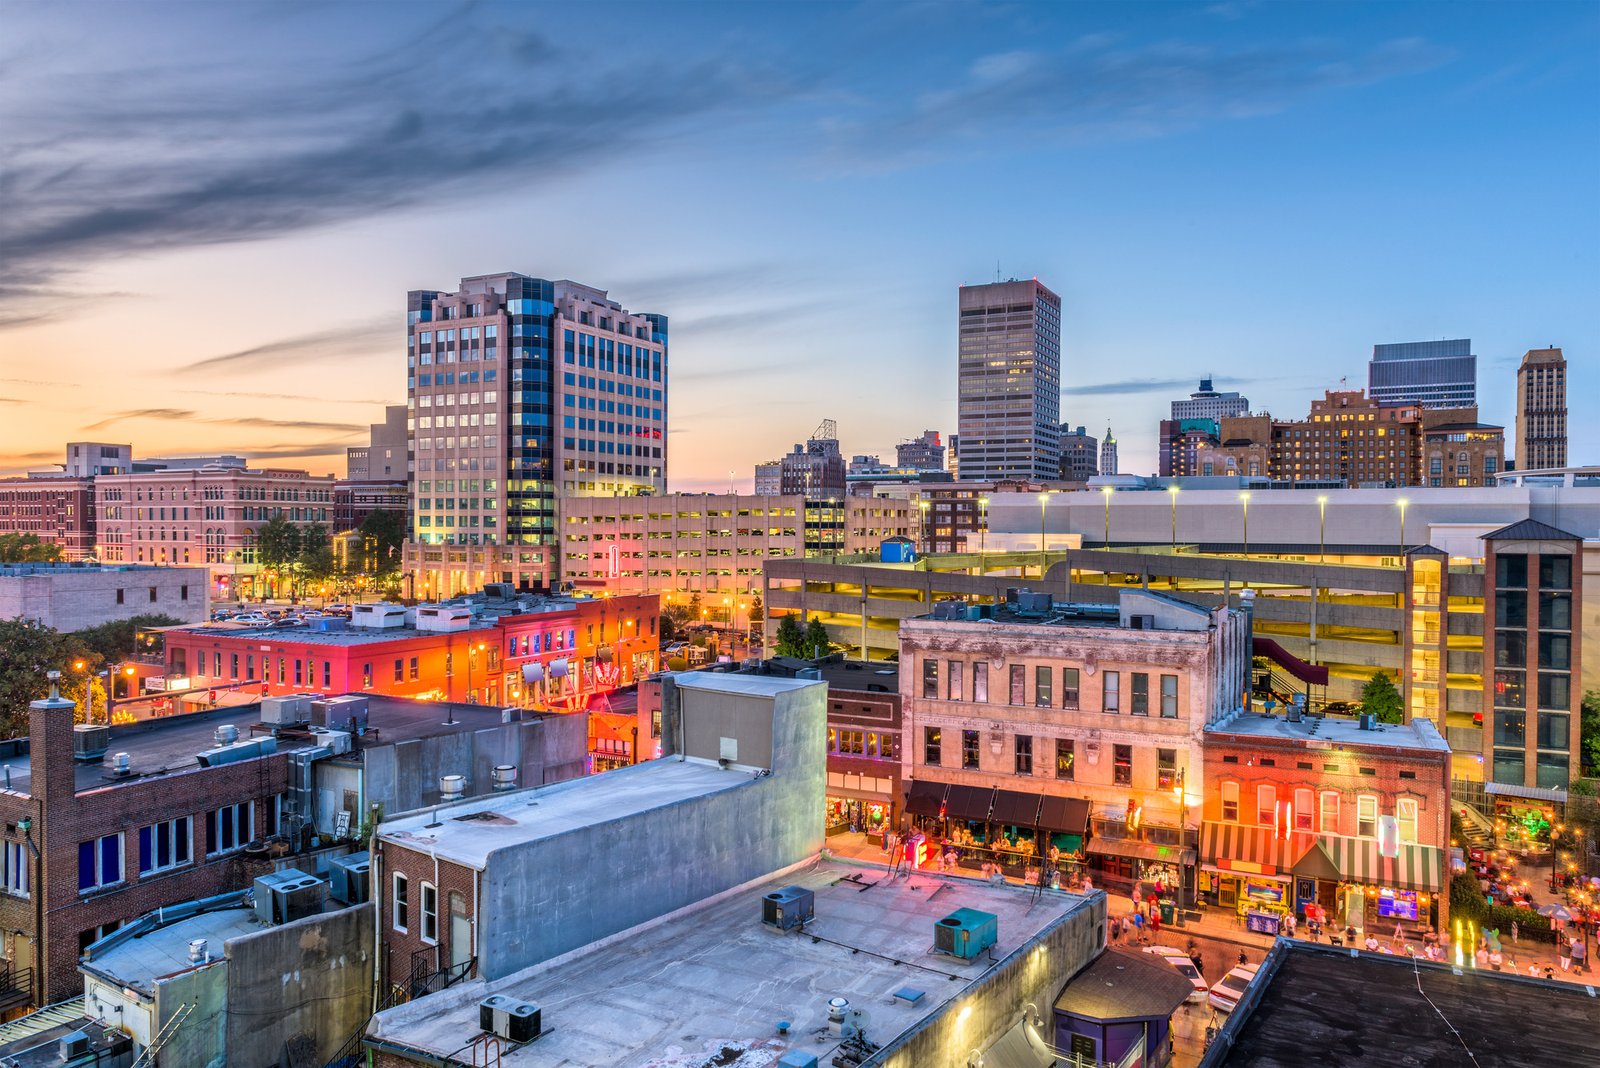
Memphis drivers have improved, moving up 26 places in Allstate’s best drivers report, but they are still mediocre at No. 100. Memphis has 13.3 fatal car crashes per 100,000 residents, the highest in the U.S. and twice the national average of 6.6. The city has 2.4 alcohol-related driving deaths per 100,000 residents, which is the fourth-highest in the U.S.
Under Tennessee law, passengers are allowed to drink alcohol in a vehicle, which can influence sober drivers to drive unsafely. Studies have also shown that young drivers who transport drunk passengers are more likely to be distracted and stressed.
Riverside, California

Riverside ranks seventh on the list of the worst cities for drivers because of its high rate of alcohol-related deaths, traffic fatalities, and insurance claims. The city also fell nine spots on Allstate’s best driver’s report, coming in at No. 134. Riverside has 2.6 alcohol-related deaths per 100,000 residents, which is the second-highest in the U.S. Riverside also ranks No. 3 in search activity for DUI, indicating a high level of drunk driving. Riverside has 9.4 traffic fatalities per 100,000 residents, which is 41% more than the average city’s rate of 6.6.
Riverside drivers file for insurance claims every eight years, which is three years sooner than the national average of 11. This indicates that Riverside drivers are more likely to be involved in accidents that result in property damage, injury, or death.
New Orleans, Louisiana
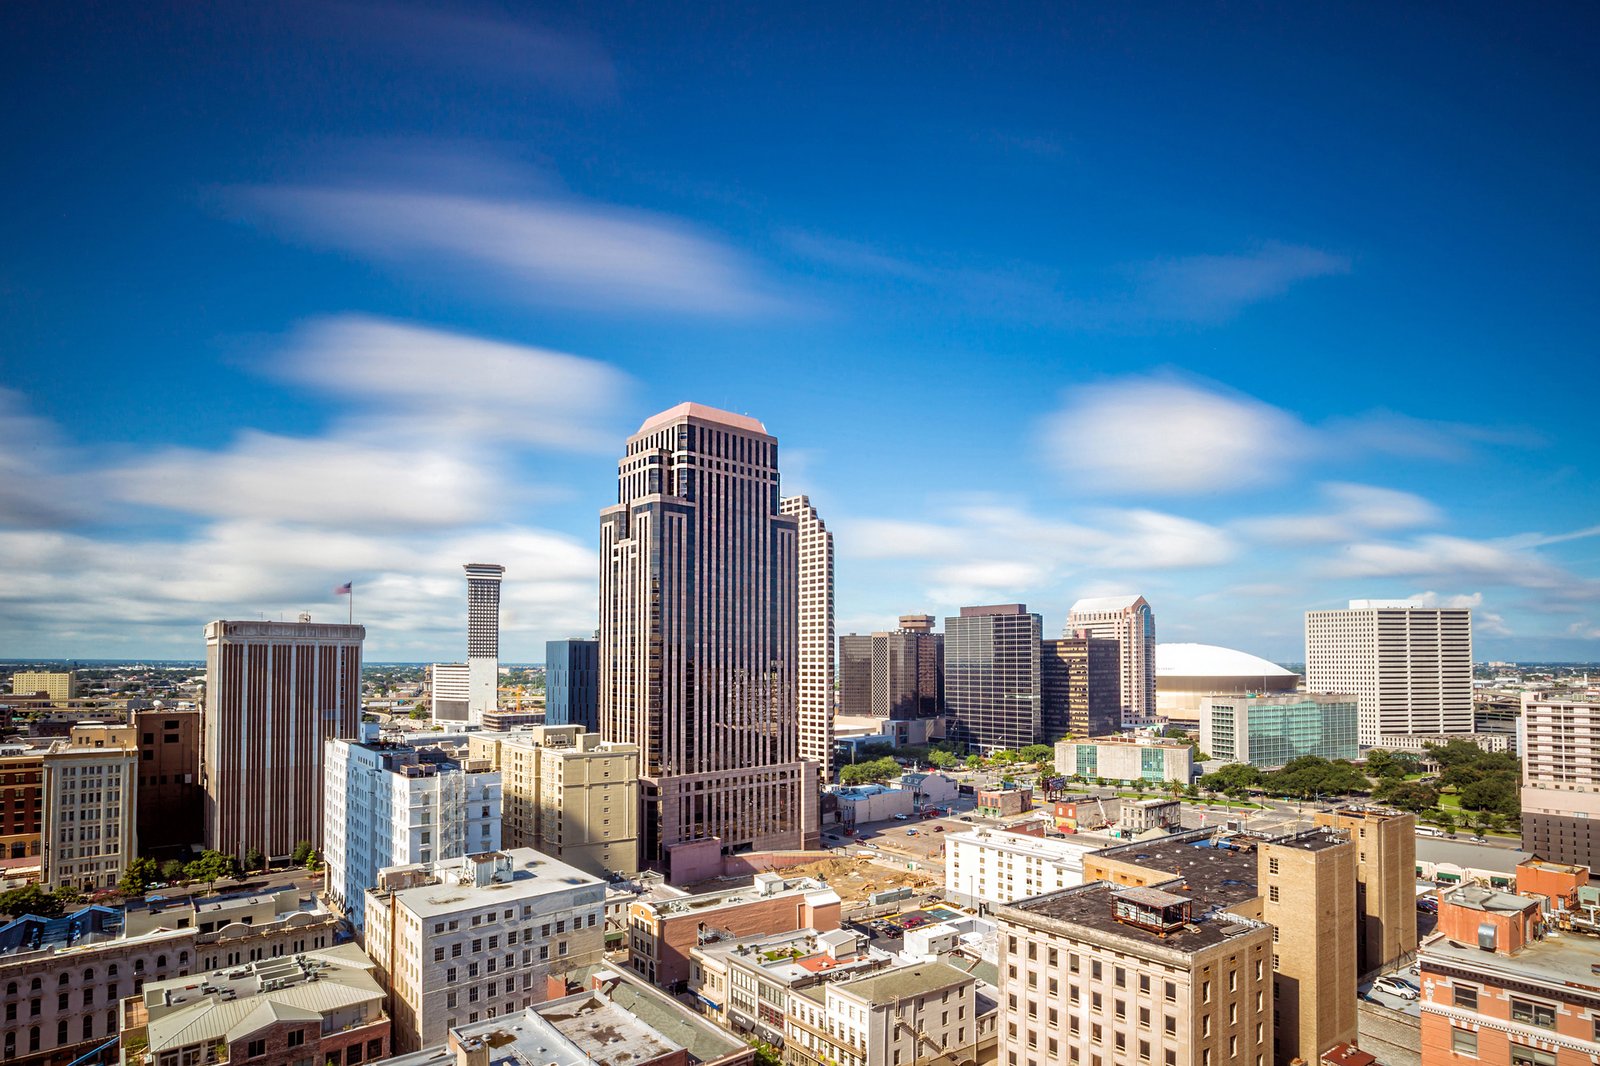
Drivers in New Orleans have to deal with poor road conditions, distracted tourists, and other hazards on the road. The city also ranks No. 177 out of 200 on Allstate’s best drivers report. New Orleans drivers pay $4,087 for car insurance, the highest among the 15 worst cities for drivers. This reflects the high risk of driving in the city, where car crashes are increasing.
The city has very relaxed drinking laws, making it a great place to party but a dangerous place to drive. New Orleans has 2.4 drunk driving deaths per 100,000 residents, which is 37% more than the average city in the study and tied for fourth-most among all 50 cities studied. New Orleans has 7.9 traffic fatalities per 100,000 residents, which is nearly 20% more than the average city’s rate of 6.6
Birmingham, Alabama

Birmingham has the second-worst record of traffic fatalities in the country, with 12.7 deaths per 100,000 residents every year. This contradicts the opinion of 22% of survey respondents who believe Birmingham has some of the best drivers in the nation. Birmingham’s traffic death rate is 91% higher than the average city in the study (6.6).
The drivers here are too courteous to honk at or confront bad drivers, which may encourage more careless driving. Drivers who get into accidents may have to pay for the damages themselves. About 20% of Birmingham drivers do not have insurance, even though the car insurance premiums in Birmingham are among the lowest in the U.S.
Sacramento, California

Sacramento used to be a quieter city, but its drivers are having trouble adapting as it grows and becomes more crowded. The city now has 7.3 traffic fatalities per 100,000 residents, 11% more than the average city’s rate of 6.6. Sacramento has two alcohol-related driving deaths per 100,000 residents, which is 15% more than the average city (1.7). Sacramento also has the highest search volume for “DUI” among all 50 cities studied, indicating a high level of drunk driving. According to Allstate’s report on the safest drivers in America, Sacramento fell 14 places to the 163rd position out of 200 cities.